CloudWatch Logs is where most AWS workloads end up talking: Lambda functions, containers, API Gateway, VPC Flow Logs, CloudTrail, databases. The console has improved a lot. In the last year AWS added facets, surrounding logs, a tabbed Log Analytics view and a new standalone app.
Some questions still have no good answer in it, though:
- What does each log group cost, and how fast is it growing?
- Which log groups never expire, or belong to a Lambda function that was deleted two years ago?
- Who ran the query that scanned a terabyte yesterday, and what did it cost?
- How do I follow one order through five services without opening five tabs?
- How do I let the payments team read their log groups, and only theirs, without writing IAM policies by hand?
Cloud Certainty TraceHound is a CloudWatch Logs console built around those questions. It runs as one CloudFormation stack in your own AWS account, and nothing leaves it.
Storage and cost per log group
TraceHound lists every log group across your accounts and Regions in one table: stored bytes, growth over the last 7 and 30 days, bytes and events ingested, retention, class, encryption, deletion protection, the AWS resource that writes to it and an estimated monthly cost.
CloudWatch only tells you how much a log group stores right now. A small collector in your account records it every day, so you get a growth history. On its first run it also backfills 90 days of ingestion from the AWS/Logs metrics, so the charts are useful from day one.
The Storage and cost page turns this into recommendations: log groups that never expire, Lambda log groups whose function no longer exists, log groups nobody has written to for months, and the fastest growers. Each comes with an estimated monthly saving, and you can set retention on many log groups at once.
Explore, the way you would expect a log tool to work
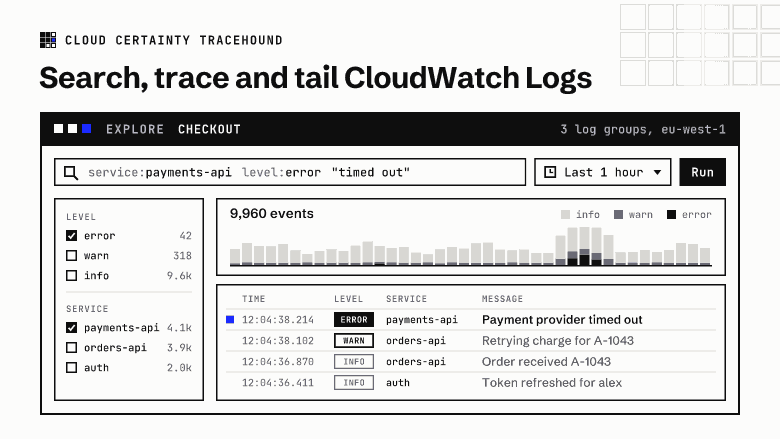
The explorer takes a Datadog-style search such as level:ERROR service:payments -healthcheck "timed out", or a full Logs Insights, OpenSearch PPL or SQL query, and runs it with Logs Insights. Results come with:
- a histogram of matches over time, coloured by level, that you can drag to zoom;
- facets built from the events on screen, with a count over every match when you need it;
- an event drawer with the JSON laid out as fields, the events around it in the same stream, and the AWS resource it came from;
- a Patterns tab that groups similar messages and shows what is new compared with the previous period;
- charts for
statsqueries, which you can add to a dashboard.
Every run shows the bytes it scanned and what it cost. The whole state lives in the URL, so a link is something a colleague can open.
Trace and Live tail
Trace takes one value, such as an order number, a request id or an X-Ray trace id, and follows it across as many log groups as you like. It splits them into Logs Insights queries of 50, runs four at a time, and draws the result as one timeline with a lane per service. Other identifiers found in those events are offered as the next thing to follow.
Live tail streams up to ten log groups as events arrive. When several people watch the same log groups, they share one Live Tail session, so the per-minute charge is paid once.
Dashboards and teams
Dashboards are built from Logs Insights queries, with variables and a shared time range. A template gallery covers Lambda, API Gateway access logs, VPC Flow Logs, CloudTrail, application JSON logs and containers.
Access is granted to users and groups on log group name patterns, such as read on /aws/lambda/payments-*. AWS enforces it: every request runs in a session narrowed to the caller's grants, and CloudTrail shows the person's email. The history records who ran each query, what it scanned and what it cost.
How it runs
TraceHound is serverless: a web app on Amplify Hosting, an API on API Gateway and Lambda, DynamoDB for its own data, and IAM roles in each account you connect. People sign in with IAM Identity Center, your own SAML or OIDC provider, or Cognito users with MFA. Logs Insights scans and Live Tail minutes are billed to you by AWS as usual, and the rest costs very little when nobody is using it.
Try it
TraceHound is in early access, with plans planned from $100 a month. Read what it does (opens in a new tab), the getting started guide (opens in a new tab), or email [email protected] to try it in your account.