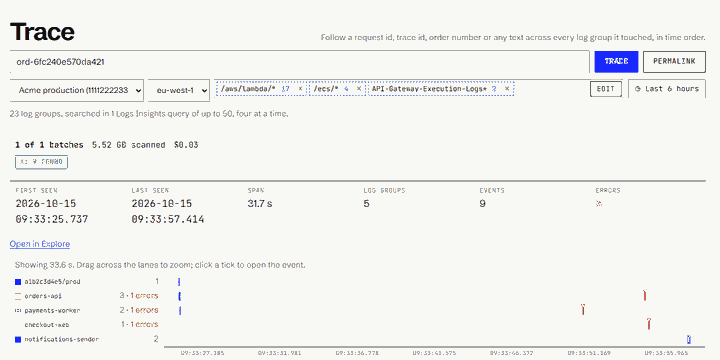
Support forwards a ticket: a customer's checkout failed at about 09:30, and here is the order number. The request went through API Gateway, an orders-api Lambda function, a payments-worker function, a checkout service on ECS and a notifications function. Each of them logs to its own log group, and each logs its own request id.
Finding out what happened means following that one order number through all of them, in time order. This post shows how to do it with Logs Insights, where it gets awkward, and how TraceHound's Trace view helps.
One query across many log groups
Logs Insights can query several log groups at once. A substring match on @message is the most reliable start, because different services rarely log the same field under the same name:
fields @timestamp, @log, @logStream, @message
| filter @message like "ord-6fc240e570da421"
| sort @timestamp asc
| limit 10000
@log tells you which log group each line came from. From the command line:
aws logs start-query \
  --log-group-names /aws/lambda/orders-api /aws/lambda/payments-worker /ecs/checkout-web \
  --start-time $(date -d '-6 hours' +%s) --end-time $(date +%s) \
  --query-string 'fields @timestamp, @log, @message | filter @message like "ord-6fc240e570da421" | sort @timestamp asc'

aws logs get-query-results --query-id <the id it returned>
Keep the time range tight. Logs Insights charges $0.005 per GB scanned, and a search like this reads every event in every log group in the range, whether it matches or not.
Where it gets awkward
- 50 log groups per query. A query can name at most 50 log groups. If you don't know which services were involved, or you have hundreds of Lambda log groups, you have to split the search into batches and merge the results yourself, in time order.
- The identifier changes on the way. The order number may only appear in the first and last hops. In between, each service logs its own request id, and the payment provider call may only carry a trace id. Following a request usually means finding the next identifier in one result and searching again.
- Concurrency. An account can run 100 Logs Insights queries at once, shared with every dashboard and person in it. A wide search split into many batches needs to queue rather than fail.
If you have field indexes on identifiers such as traceId or requestId, the filterIndex command with SOURCE can search up to 10,000 log groups chosen by name prefix and skip the events that can't match. It is worth setting up for the fields you search most.
What TraceHound does
TraceHound's Trace page takes one value, such as an order number, a request id or an X-Ray trace id, and a set of log groups. Patterns are fine, so /aws/lambda/* and /ecs/* together might cover dozens of log groups. Then it:
- splits the log groups into Logs Insights queries of 50 and runs four at a time, showing the progress, bytes scanned and cost of each batch;
- merges every match into one list in time order;
- draws a timeline with one lane per log group, errors marked in red, which you can drag to zoom;
- lists the identifiers it found in those events, such as request ids, trace ids, user ids and UUIDs, with how many events and log groups each appears in.
For the order above, one search over 23 log groups found 9 events in 5 services, spanning 31.7 seconds, with 3 errors: the payment provider timed out, payments-worker hit its timeout, and the checkout failed. It scanned 5.5 GB and cost about three cents.
From there you can follow any identifier found, either added to this trace or as a new one, and open X-Ray for a trace id. The page's link holds the value, log groups and time range, so it can go straight into the incident ticket. In the explorer, any event's drawer offers "Follow in Trace" for the ids in it.
Trace only searches the log groups you are allowed to read. The queries run in your own session, so CloudTrail records them under your name.
Try it
TraceHound is in early access. See Trace (opens in a new tab) in the user guide, read about TraceHound (opens in a new tab), or email [email protected].