DatabaseMemoryUsagePercentage is at 85% and climbing, evictions have started and someone asks the obvious question: what is using all this memory? CloudWatch can't answer it. The answer is in the keys.
Don't run KEYS on production
The quick way to list keys, KEYS *, walks the whole keyspace in one go. Valkey and Redis OSS run commands one at a time, so while it walks millions of keys, every other client waits. On a busy cache that is an outage you caused while investigating a near-outage.
SCAN returns the same keys in small pages with a cursor, so other commands run in between. It is the only safe way to walk a production keyspace, and it is what everything below is built on.
Sampling a keyspace
You rarely need every key to know where memory goes. A sample of 10,000 keys says a great deal about a cache with ten million, as long as it is spread across the keyspace.
For each sampled key, three commands answer the useful questions:
TYPE key: string, hash, list, set, sorted set, stream or JSON.MEMORY USAGE key SAMPLES 5: roughly how many bytes it uses, without reading every element of a large collection.PTTL key: how long it has to live, or-1if it never expires.
Pipeline them, a thousand keys per round trip, and a sample of 10,000 keys takes seconds. In cluster mode, scan every primary in proportion to its DBSIZE so the sample reflects the whole cache.
ElastiCache Serverless doesn't allow MEMORY USAGE. There you can estimate a key's size from its length and its value's size (STRLEN, HLEN, LLEN, SCARD, ZCARD, XLEN), and say clearly that the numbers are estimates.
Reading the result
Group the sample three ways:
- By key prefix. Split key names on
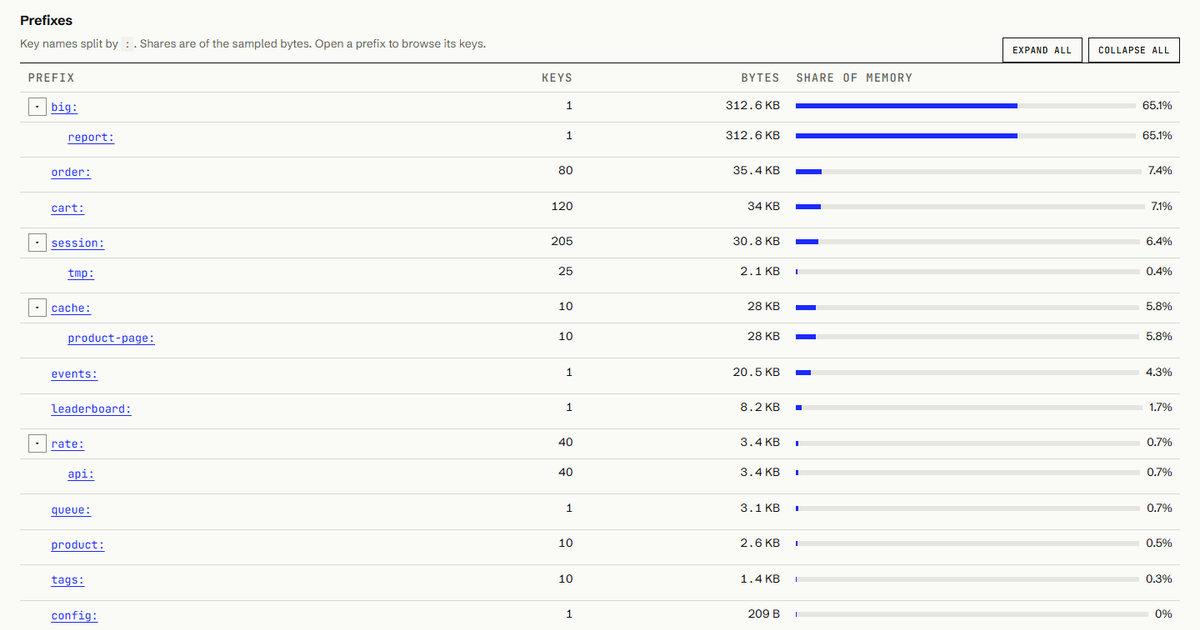
:and build a tree:session:41%,cart:22%,cache:product-page:18%. Naming conventions make this the most useful view by far. - By type. One large hash or sorted set can outweigh millions of small strings.
- By TTL. Keys with no expiry are the usual suspects: cached pages, one-off migration keys and sessions whose expiry was never set.
Then look at the biggest keys individually: a 300 MB report cached forever is easy to fix once you know it is there.
Cleaning up without hurting production
Once you know that, say, cache:product-page:* keys have no TTL and use a fifth of the memory, the fix is to expire them. Doing that by hand with a loop of SCAN and EXPIRE from a laptop works, until the laptop sleeps, the VPN drops or the loop runs too fast and slows the application.
A safer pattern is a paced job: scan a page, apply EXPIRE or UNLINK to the matching keys in a pipeline, store the cursor, wait so the job stays at a set rate, repeat. If it fails, it resumes from the stored cursor. If someone notices a mistake, it can be cancelled.
How Memora does it
Cloud Certainty Memora's Analysis tab runs exactly this sampling through its connector in your VPC, using SCAN, never KEYS. You choose the sample size, the delimiter, an optional key pattern and the depth of the prefix tree. The report shows memory by type, the TTL distribution, an expandable prefix tree with each prefix's share of memory, the 50 biggest keys, and recommendations. Analyses are stored with key names and sizes, never values.
From a recommendation such as "40% of memory has no TTL", one click opens a bulk job for that prefix. You preview how many keys match, set the TTL and a rate in keys per second, type the cache's name to confirm, and the job runs as a Step Functions workflow in your account. It is paced, resumable and cancellable, and it re-checks your permission and key patterns before every batch.
Memora is in early access: cloudcertainty.com/memora (opens in a new tab).