Every AWS estate that has run Lambda for a few years has the same two lists hiding in it. One is functions nobody has called in months: a prototype, a migration that finished, a cron job for a system that no longer exists. The other is functions on runtimes AWS has stopped patching. Both carry risk, and both are surprisingly hard to see in the console.
Why the console doesn't show them
The Lambda function list shows the runtime, but not when a function last ran. There is no "last invoked" column, and no way to sort by it. AWS's own guidance for finding unused functions is to turn on CloudTrail data events for Lambda and query them with Athena, which works but costs money and only covers the time since you switched it on.
Runtime deprecation has a similar gap. AWS emails you about functions on deprecating runtimes, but the notices cover the $LATEST version only, and checking the rest means running the CLI in every Region of every account. A function that is unused and on a deprecated runtime is the easiest win of all, and it is exactly the case nobody notices.
The data you already have
You don't need CloudTrail for this. Every function publishes an Invocations metric to CloudWatch, and CloudWatch keeps hourly data for 15 months. Ask for the daily sum over that period and the last day with a non-zero value is the day the function was last invoked:
aws cloudwatch get-metric-statistics \
  --namespace AWS/Lambda --metric-name Invocations \
  --dimensions Name=FunctionName,Value=my-function \
  --start-time "$(date -u -d '455 days ago' +%Y-%m-%dT00:00:00Z)" \
  --end-time "$(date -u +%Y-%m-%dT00:00:00Z)" \
  --period 86400 --statistics Sum \
  --query 'sort_by(Datapoints[?Sum > `0`], &Timestamp)[-1].Timestamp'
An empty answer means no invocation in 15 months. Two things to know if you script this for a whole account:
- Use explicit queries, not SEARCH. A CloudWatch
SEARCHexpression only finds metrics with data in the last two weeks, so it silently misses exactly the functions you are looking for. Query each function by name;GetMetricDatatakes up to 500 queries per call. - It costs a little.
GetMetricDatais charged per metric requested, about $0.01 per 1,000. One query per function per day is pennies, but running it every time someone opens a dashboard is not, so cache the answer for a day.
For runtimes, ListFunctions returns each function's runtime; compare it with the dates on the Lambda runtimes page (opens in a new tab). Container image functions have no runtime field, so check their base images separately.
Turning it into a clean-up list
A list of names isn't a clean-up yet. Before deleting anything, check for triggers that run rarely (a yearly report, a disaster recovery path), event source mappings that are only disabled, and aliases that something else invokes. Delete in stages: remove triggers first, wait a cycle, then delete the function and its log group. Log groups that never expire are worth catching in the same pass, because they keep costing money after the function has gone.
How FunctionPilot does it
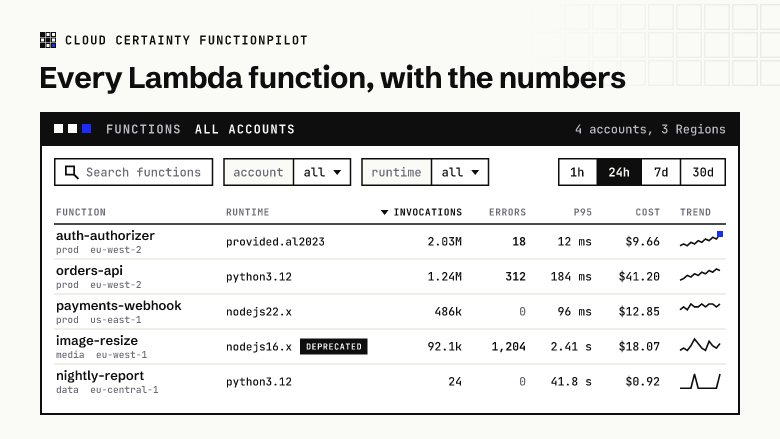
FunctionPilot's function table has a Last invoked column for every function across your accounts and Regions, worked out from 15 months of daily metrics by an hourly job in your own account and cached for a day, so viewing it never repeats the cost. An Unused for filter (7, 30, 90 or 180 days, or any number) turns it into a list, deprecated and soon-deprecated runtimes carry a badge, and the findings page combines both with functions whose log groups never expire. Today the runtime check covers each function's $LATEST; checking every published version is on our roadmap.
In one real development account we tested on, more than two thirds of the functions had not been called for 30 days, and nearly a third not at all in 15 months. Your numbers will differ, but probably not by as much as you would hope.
FunctionPilot is in early access. If you would like to try it on your accounts, get in touch (opens in a new tab).