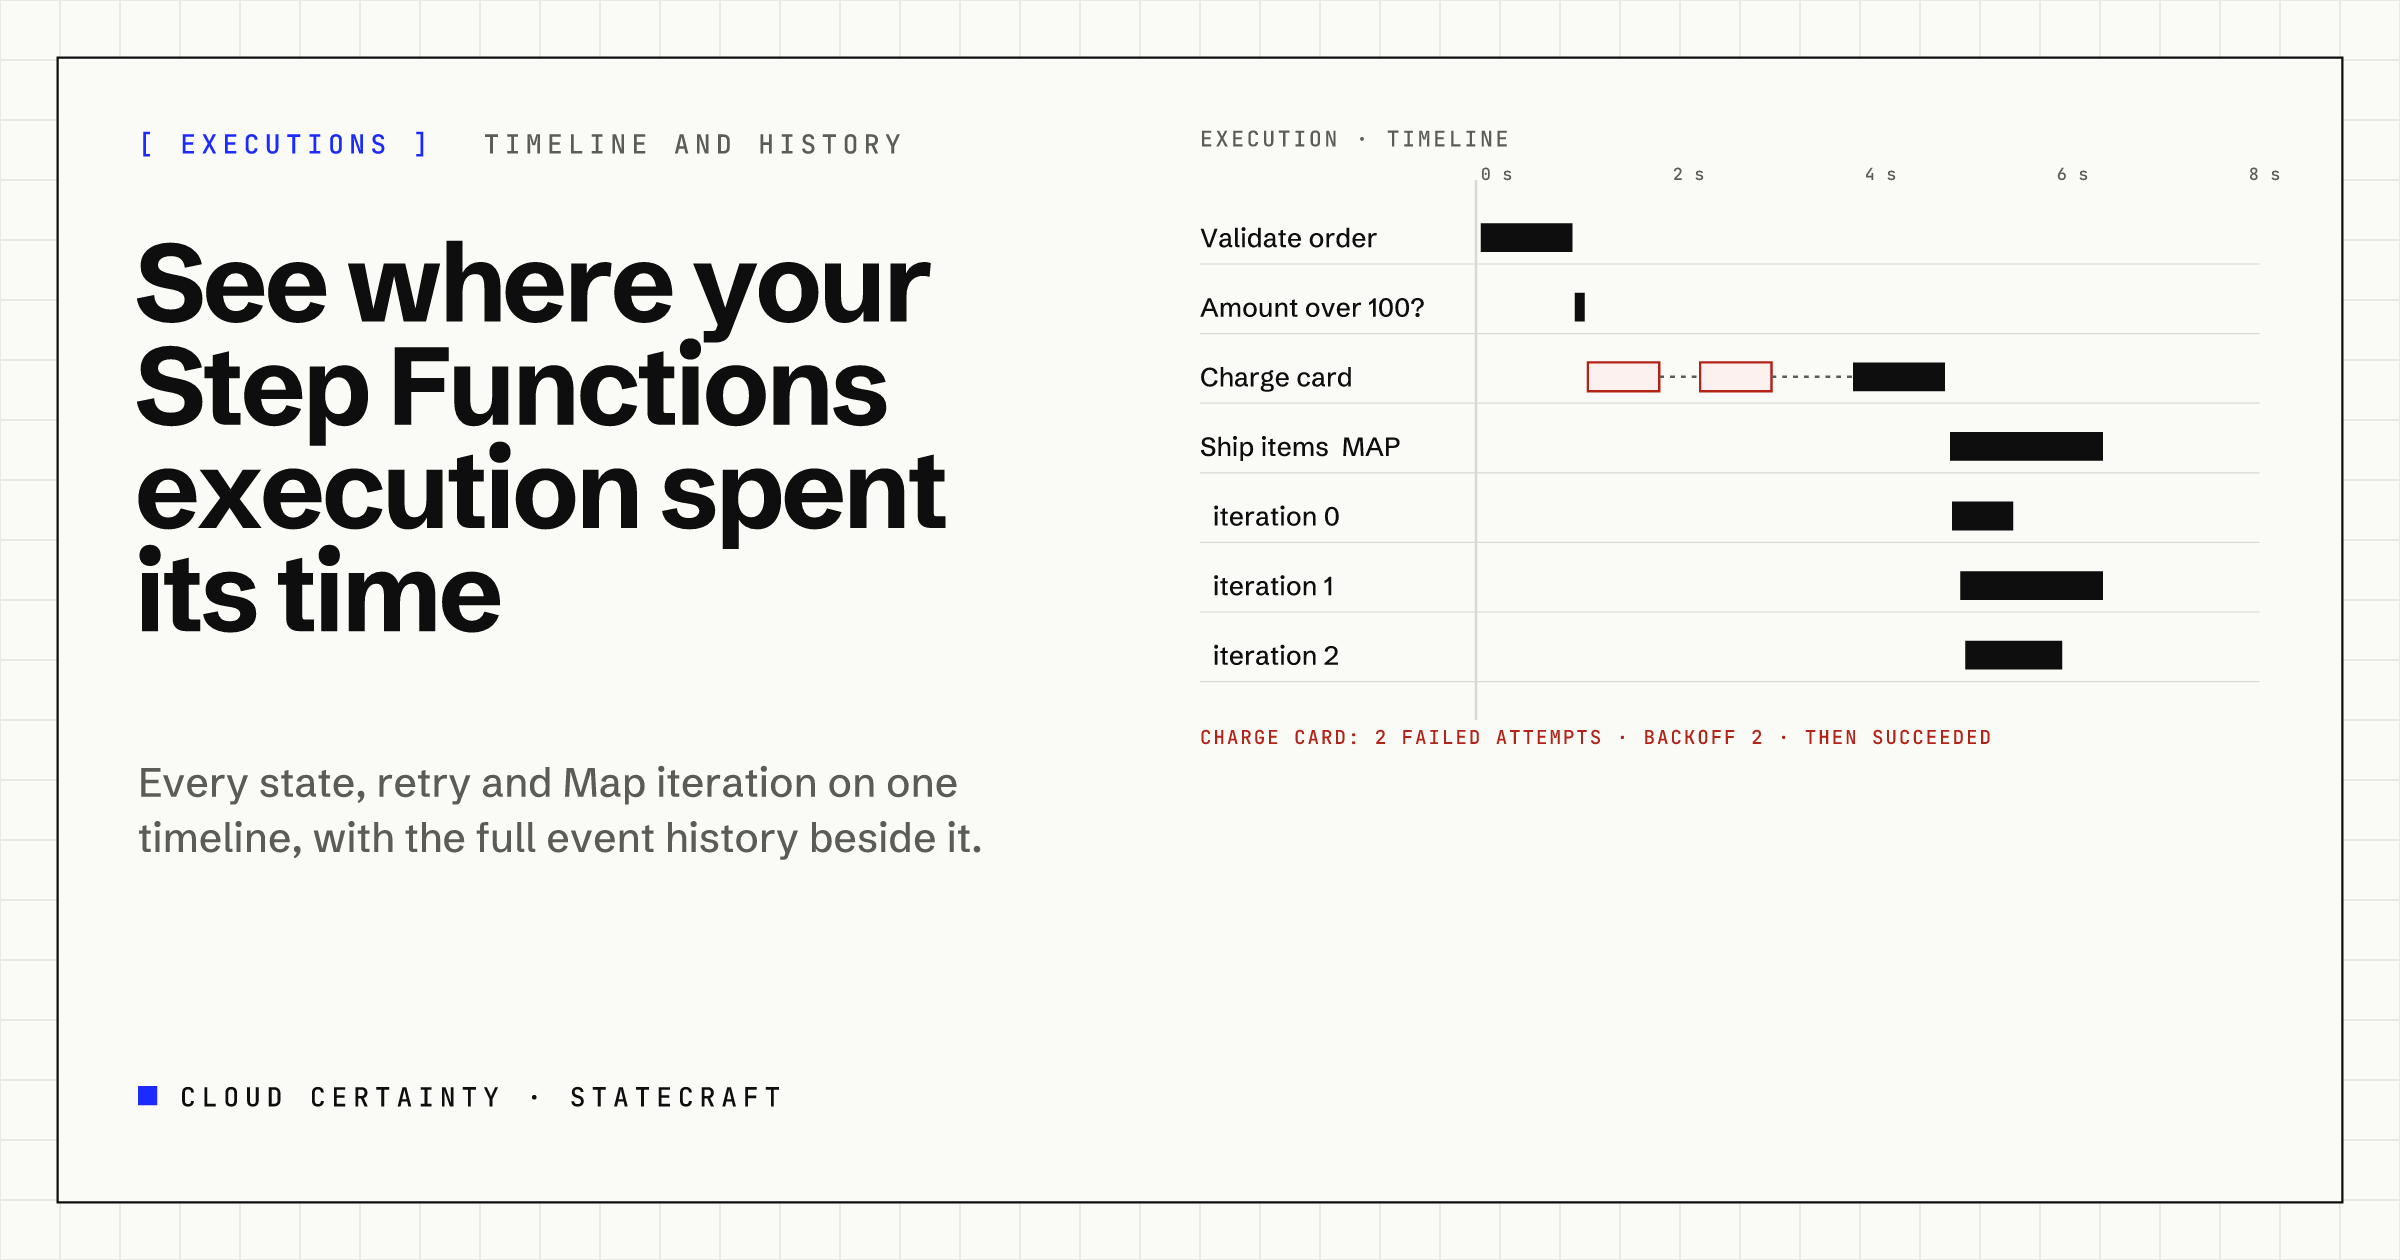
When a Step Functions execution fails or takes far too long, the answer is in its event history. Every state entered and exited, every task scheduled, every retry and every Map iteration is an event there. The trouble is reading it: a busy execution has thousands of events, and an execution can hold up to 25,000 before Step Functions fails it.
GetExecutionHistory returns at most 1,000 events a call, so tools page through it, and a list of events is still not an explanation. StateCraft reads the whole history and shows it in four ways.
The graph: what happened, state by state
The execution opens on its workflow graph, drawn from the exact definition that execution ran, not the current one. Each state shows its status: succeeded, failed, caught, retrying, still running or never reached. The path the execution took is highlighted, and each state is labelled with its duration, its retries, or for a Map, how many iterations succeeded and failed.
Select a state and the side panel shows:
- Every attempt with its error and the backoff before the next one.
- Input and output, with a view of exactly what changed between them.
- The task's resource and parameters, and for JSONata workflows, the variables it assigned.
- For Map and Parallel states, an iteration picker that recolours the inner graph for the iteration you choose.
From there, Test this state runs that one state through Step Functions' TestState API with the input it actually received.
The timeline: where the time went
The timeline tab is a Gantt chart of the run. Every state is a bar on one time axis. Retries are separate bars with the backoff waits between them drawn in, so a state that "took 40 seconds" turns out to be three failed calls and two waits. Map iterations and Parallel branches get their own lanes, which shows at a glance whether one slow item held up the whole Map.
A filter keeps only failures and retries. While an execution is running, the timeline grows as you watch.
The events: everything, searchable
The events tab is the full history, loaded a thousand events a call up to the 25,000 limit, in a table that stays fast at that size. Filter by event type, state or failures only, search the text, expand any event for its details, or switch to a compact view that folds scheduled, started and succeeded events into one row per step. Download the whole history as JSON when you need it elsewhere.
The header shows how close the execution is to the 25,000-event limit, which is usually the first sign that a loop needs a counter or the work belongs in a child workflow.
Map Runs: the part the console makes hardest
A Distributed Map hands its items to child executions, often thousands of them. StateCraft's Map Run explorer shows each run's progress for items and child executions, its tolerated failure and maximum concurrency, and lets you change those two while the run is going. Failed children are grouped by error and cause, so "312 failed" becomes "309 throttled by the payment API, 3 bad records", and each child opens as an execution of its own.
Everything else on the page
- Who started it, when it was started through StateCraft. Step Functions doesn't record that.
- An estimated cost, from the state transitions in the history and your price per thousand transitions.
- Redrive status, with the reason when an execution can't be redriven, and how much of the 14-day redrive window is left.
- Compare with another execution of the same workflow: the paths, the duration of each state, and input and output differences.
- Express executions, which Step Functions' execution APIs don't list, read from the workflow's CloudWatch Logs log group when logging is on at the ALL level.
Who can see the data
Inputs and outputs often hold customer data. In StateCraft, seeing them needs the data permission on that state machine. Without it, StateCraft asks Step Functions for metadata only, so people can still follow the graph and timeline without reading payloads.
Try it
StateCraft is in early access. Read the user guide (opens in a new tab), see the StateCraft page (opens in a new tab), or email [email protected] to join the early access programme.