Amazon Athena is one of the easiest ways to query data in S3. Point it at a table in the Glue Data Catalog, write SQL, pay for what you scan. The engine has kept getting better. The console around it has not kept up.
If your team uses Athena every day, you will recognise the workarounds: results pasted into a spreadsheet to draw a chart, a Slack thread asking who ran the query that scanned two terabytes, the same saved query copied into three workgroups by hand. SQLark is our answer to those workarounds.
What the Athena console leaves out
The console is built for running one query at a time. A few things it doesn't do:
- No charts. The only graphs are the query plan and stage views, which are for tuning, not for reading results. AWS's own guidance for visualising Athena data points you to Amazon Managed Grafana (opens in a new tab) or QuickSight.
- A short, anonymous history. Recent queries are kept for 45 days (opens in a new tab), per workgroup, and a query execution has no field for the person who started it. Finding out who ran something means CloudTrail.
- Saved queries stuck in place. A saved query belongs to one workgroup, can't be moved, and Athena keeps no history of changes (opens in a new tab) to it.
- No sharing of a result with a colleague, other than downloading a CSV and sending it.
- Cost by workgroup only. You can see what a workgroup scanned, not who scanned it.
What SQLark adds
SQLark is a web console for Athena that your team signs into. It has five main parts.
A SQL workspace. Tabs that survive a reload, an editor with autocomplete from your Glue catalogue (databases, tables, and the columns of the tables in your FROM clause), a schema browser, and a results grid that pages through large results instead of loading them all. Right-click a value to add it to the WHERE clause. Every run shows the time spent queued, planning and running, the data scanned and the estimated cost.
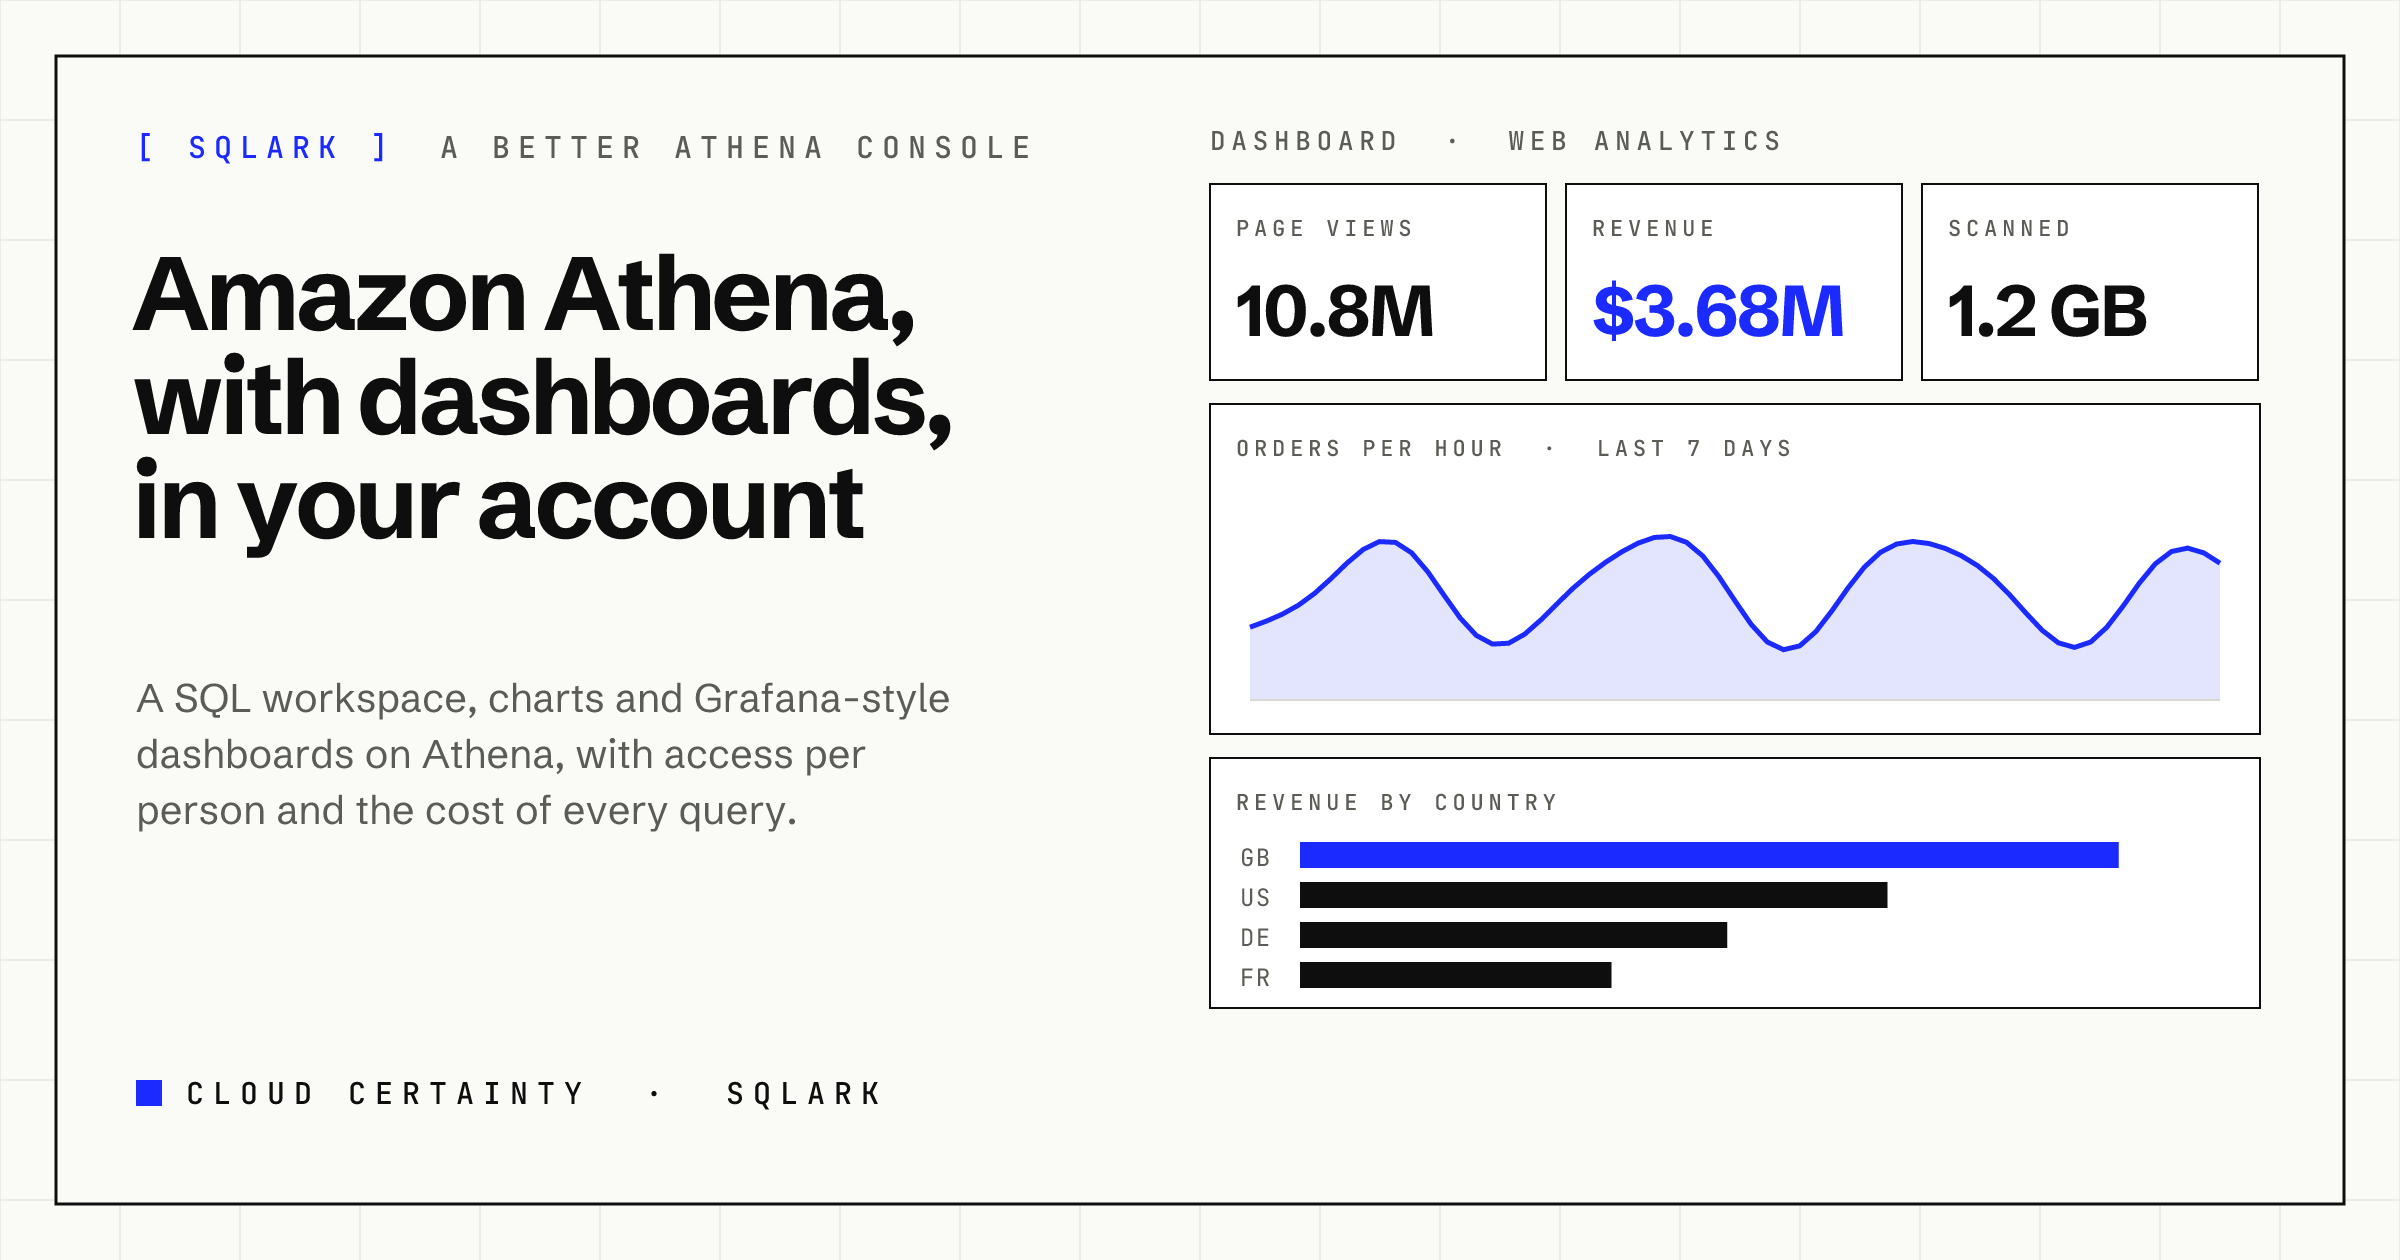
Charts and dashboards. Chart any result as a time series, bar, pie, stat, gauge, scatter, heatmap or table. Put charts on dashboards with variables, a shared time range, auto-refresh and kiosk mode, much as you would in Grafana. Time macros such as $__timeFilter and $__partitionFilter keep each refresh down to the data on screen.
History with names and costs. Every query run through SQLark is recorded with the person, the SQL, the data scanned and the cost, for as long as your plan keeps history, not 45 days.
Saved queries and dashboards you can share. Folders, tags, private or shared, versions with a diff and restore. Snapshots freeze a result or a whole dashboard so you can send a link instead of a spreadsheet.
Access per team. Administrators grant users and groups browse, query, download or ddl on workgroup and database patterns. SQLark turns each grant into an AWS session policy, so AWS itself enforces it, and CloudTrail records the person's email on every call.
Why it runs in your own account
SQLark is not a SaaS that you send your data to. It deploys as one CloudFormation stack in your AWS account: a Cognito user pool for sign-in (with IAM Identity Center, SAML or OIDC), an API on API Gateway and Lambda, a DynamoDB table, and the web app on Amplify Hosting. Your queries run with credentials from your account, results stay in your S3 buckets, and nothing about your data or your usage is sent to us.
That also means it costs almost nothing when nobody is using it. You pay AWS for the Lambda, DynamoDB and API requests your team makes, and Athena's usual price for the data your queries scan.
Other accounts are connected with a small role stack (or a StackSet), so one SQLark can cover a production account, a data lake account and a sandbox, each with its own access level.
Who it is for
SQLark is for teams that already use Athena and want it to feel like a shared tool rather than a single-user console:
- Data and analytics engineers who live in the editor and want autocomplete, history and charts in one place.
- Platform and FinOps teams who need to know who is scanning what, and to put a budget on it.
- Anyone who wants dashboards on Athena without giving a dashboard tool one powerful role that every viewer's queries run as.
Where it stands
SQLark is in early access. You can watch the two-minute demo and read the documentation on the SQLark page (opens in a new tab). If you run Athena and would like to try it in your own account, get in touch (opens in a new tab).
Over the next few posts we will go deeper into the parts teams ask about most: finding out who ran a query and what it cost, building dashboards that don't scan your whole data lake, access per team that AWS enforces, and exploring results that are far too big for a browser.