Looking at your Lambda functions is not free. Every number on a dashboard came from an AWS API call, and several of those APIs charge per call. For one engineer looking at one function, the amounts are tiny. For a team with a dashboard of 500 functions that everyone keeps open and refreshes every minute, they add up, and they show up on the bill under CloudWatch rather than under the tool that caused them.
What each call costs
These are us-east-1 list prices at the time of writing; check the pricing pages for your Region.
| What you look at | AWS API | Charged |
|---|---|---|
| Metrics and charts | GetMetricData | about $0.01 per 1,000 metrics requested |
| Log queries, cold starts, error grouping | Logs Insights StartQuery | about $0.005 per GB of logs scanned |
| Live tail | StartLiveTail | about $0.01 per session minute, after a monthly free allowance |
| Actual cost per function | Cost Explorer GetCostAndUsageWithResources | $0.01 per request |
| Function lists, configuration, CloudTrail history | Lambda, CloudTrail LookupEvents | free, but rate limited |
Take a table of 500 functions with seven numbers each and a sparkline: that is about 4,000 metrics, or $0.04, every time it loads. One person keeping it open with a refresh every minute through the working day loads it about 10,000 times a month, which is around $400, for looking. A team of ten doing the same pays ten times that. Logs Insights is the other one to watch: a query over a busy function's last 30 days can scan tens of gigabytes, and a dashboard that reruns it on every visit pays every time.
The limits that shape the design
Cost isn't the only constraint:
GetMetricDatatakes up to 500 queries per call. ASEARCHexpression can cover a whole Region in one query, but returns at most 500 series and only finds metrics with data in the last two weeks.- Long ranges can come back partial. Over 30 days, a function invoked every minute has a lot of data to add up, and CloudWatch can return a series as
PartialDatawith no values and no next token. Code that ignores the status reads that as zero invocations. We hit exactly this while testing against a real account: the busiest function in the Region showed 0 for 30 days until we re-read partial series one function at a time. - The Lambda control plane shares 15 requests per second between most read APIs, so calling
GetFunctionConcurrencyorGetPolicyfor every row of a big table isn't an option. - CloudTrail
LookupEventsallows two requests per second per account and Region. - Logs Insights runs a limited number of queries at once per account, shared with everyone else's dashboards.
Patterns that keep it cheap
- Cache by what was asked, not by who asked. A Region's metrics for "last 24 hours" are the same for everyone, so compute them once and filter per person on the way out.
- Make freshness depend on the range. The last hour needs refreshing every minute; the last 30 days hardly changes in half an hour; a fixed range in the past never changes at all.
- One refresh at a time. When an entry goes stale, let one request refresh it while everyone else gets the previous copy for those few seconds, instead of ten simultaneous fills.
- Schedule what is expensive and slow-moving. Cold start rates, error grouping and log volumes don't need to be live; an hourly job is plenty.
- Share live sessions. Two people tailing the same functions should pay for one Live Tail session, and it should stop when nobody is watching.
How FunctionPilot applies them
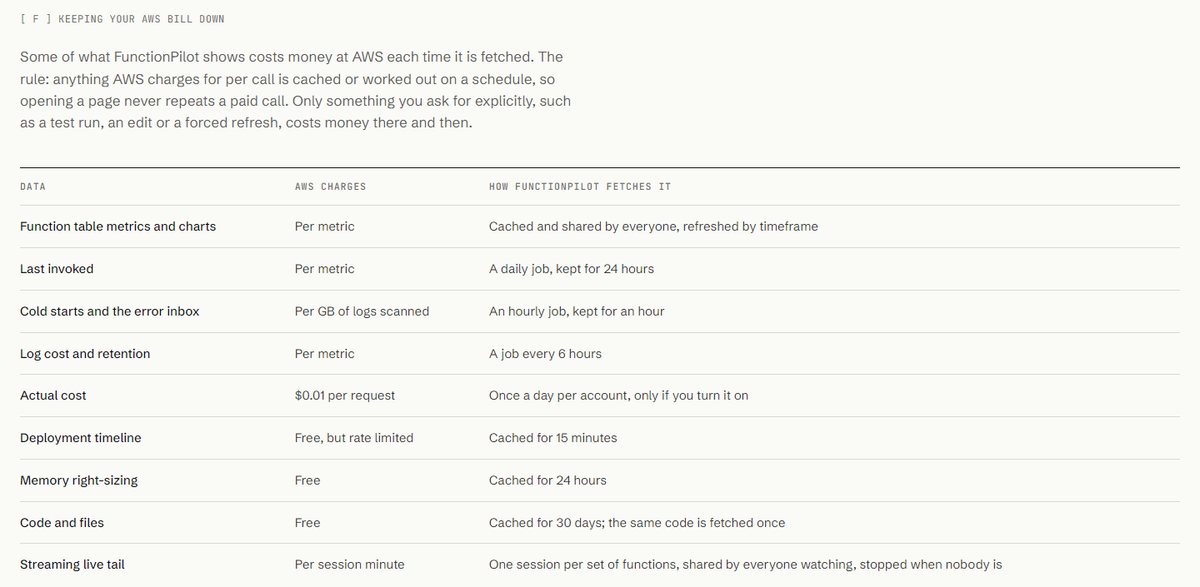
FunctionPilot follows one rule: anything AWS charges for per call is cached or worked out on a schedule, so opening a page never repeats a paid call. Only something you ask for explicitly, such as a test run, a code edit or a forced refresh, costs money there and then.
- Function table metrics live in a shared cache in your account, fresh for a minute for the last hour, five minutes for a day and up to half an hour for 30 days, with a lease so a burst of viewers costs one fill. Refresh is ignored for data younger than 30 seconds. The same 500-function table costs one fill per freshness window however many people have it open.
- An hourly worker in your account fills last invoked dates, cold starts, the error inbox and log costs. Cost Explorer runs once a day, and only if you switch it on. Each job can be turned off in Settings.
- Code is cached by its hash, so the same package is never downloaded twice; the deployment timeline is cached for 15 minutes; Compute Optimizer recommendations for a day.
- Live tail runs one shared session per set of functions, and stops when the last viewer leaves.
- A usage card shows admins what FunctionPilot asked of CloudWatch over the last 30 days and what the cache saved.
FunctionPilot is in early access. If your CloudWatch bill has a line you can't explain, tell us about it (opens in a new tab).