Putting Athena behind a dashboard changes the economics. A query you run once a day in the editor becomes a panel that runs every five minutes, for every person who has the dashboard open. Athena charges $5 per terabyte scanned (opens in a new tab), so a careless panel over a big table is a real line on the bill.
The good news is that most of the cost is avoidable. It comes down to three things: scanning only the partitions the panel shows, not scanning at all when the answer is already known, and not running more queries at once than the account allows.
The query a dashboard actually needs
A typical panel shows something over the dashboard's time range: page views per hour for the last seven days, say. Written naively against a table partitioned by day, it looks like this:
SELECT date_trunc('hour', event_time) AS t, count(*) AS views
FROM analytics.web_events
WHERE event_time > now() - interval '7' day
GROUP BY 1
ORDER BY 1
The filter is on event_time, a column inside the files, not on the partition column. Athena can't skip a partition based on it, so it reads every day of the table to find the last seven. On a table with two years of events, that is roughly a hundred times more data than the chart shows.
The fix is to filter on the partition column too:
WHERE dt BETWEEN '2026-10-07' AND '2026-10-14'
  AND event_time BETWEEN TIMESTAMP '2026-10-07 09:30:00' AND TIMESTAMP '2026-10-14 09:30:00'
Now Athena reads only those seven partitions, and the time filter trims the edges. The catch is that a dashboard's time range moves, so the dates can't be written by hand.
Time macros
This is what dashboard macros are for. In SQLark (and in Grafana's Athena data source, where the idea comes from) you write the panel once:
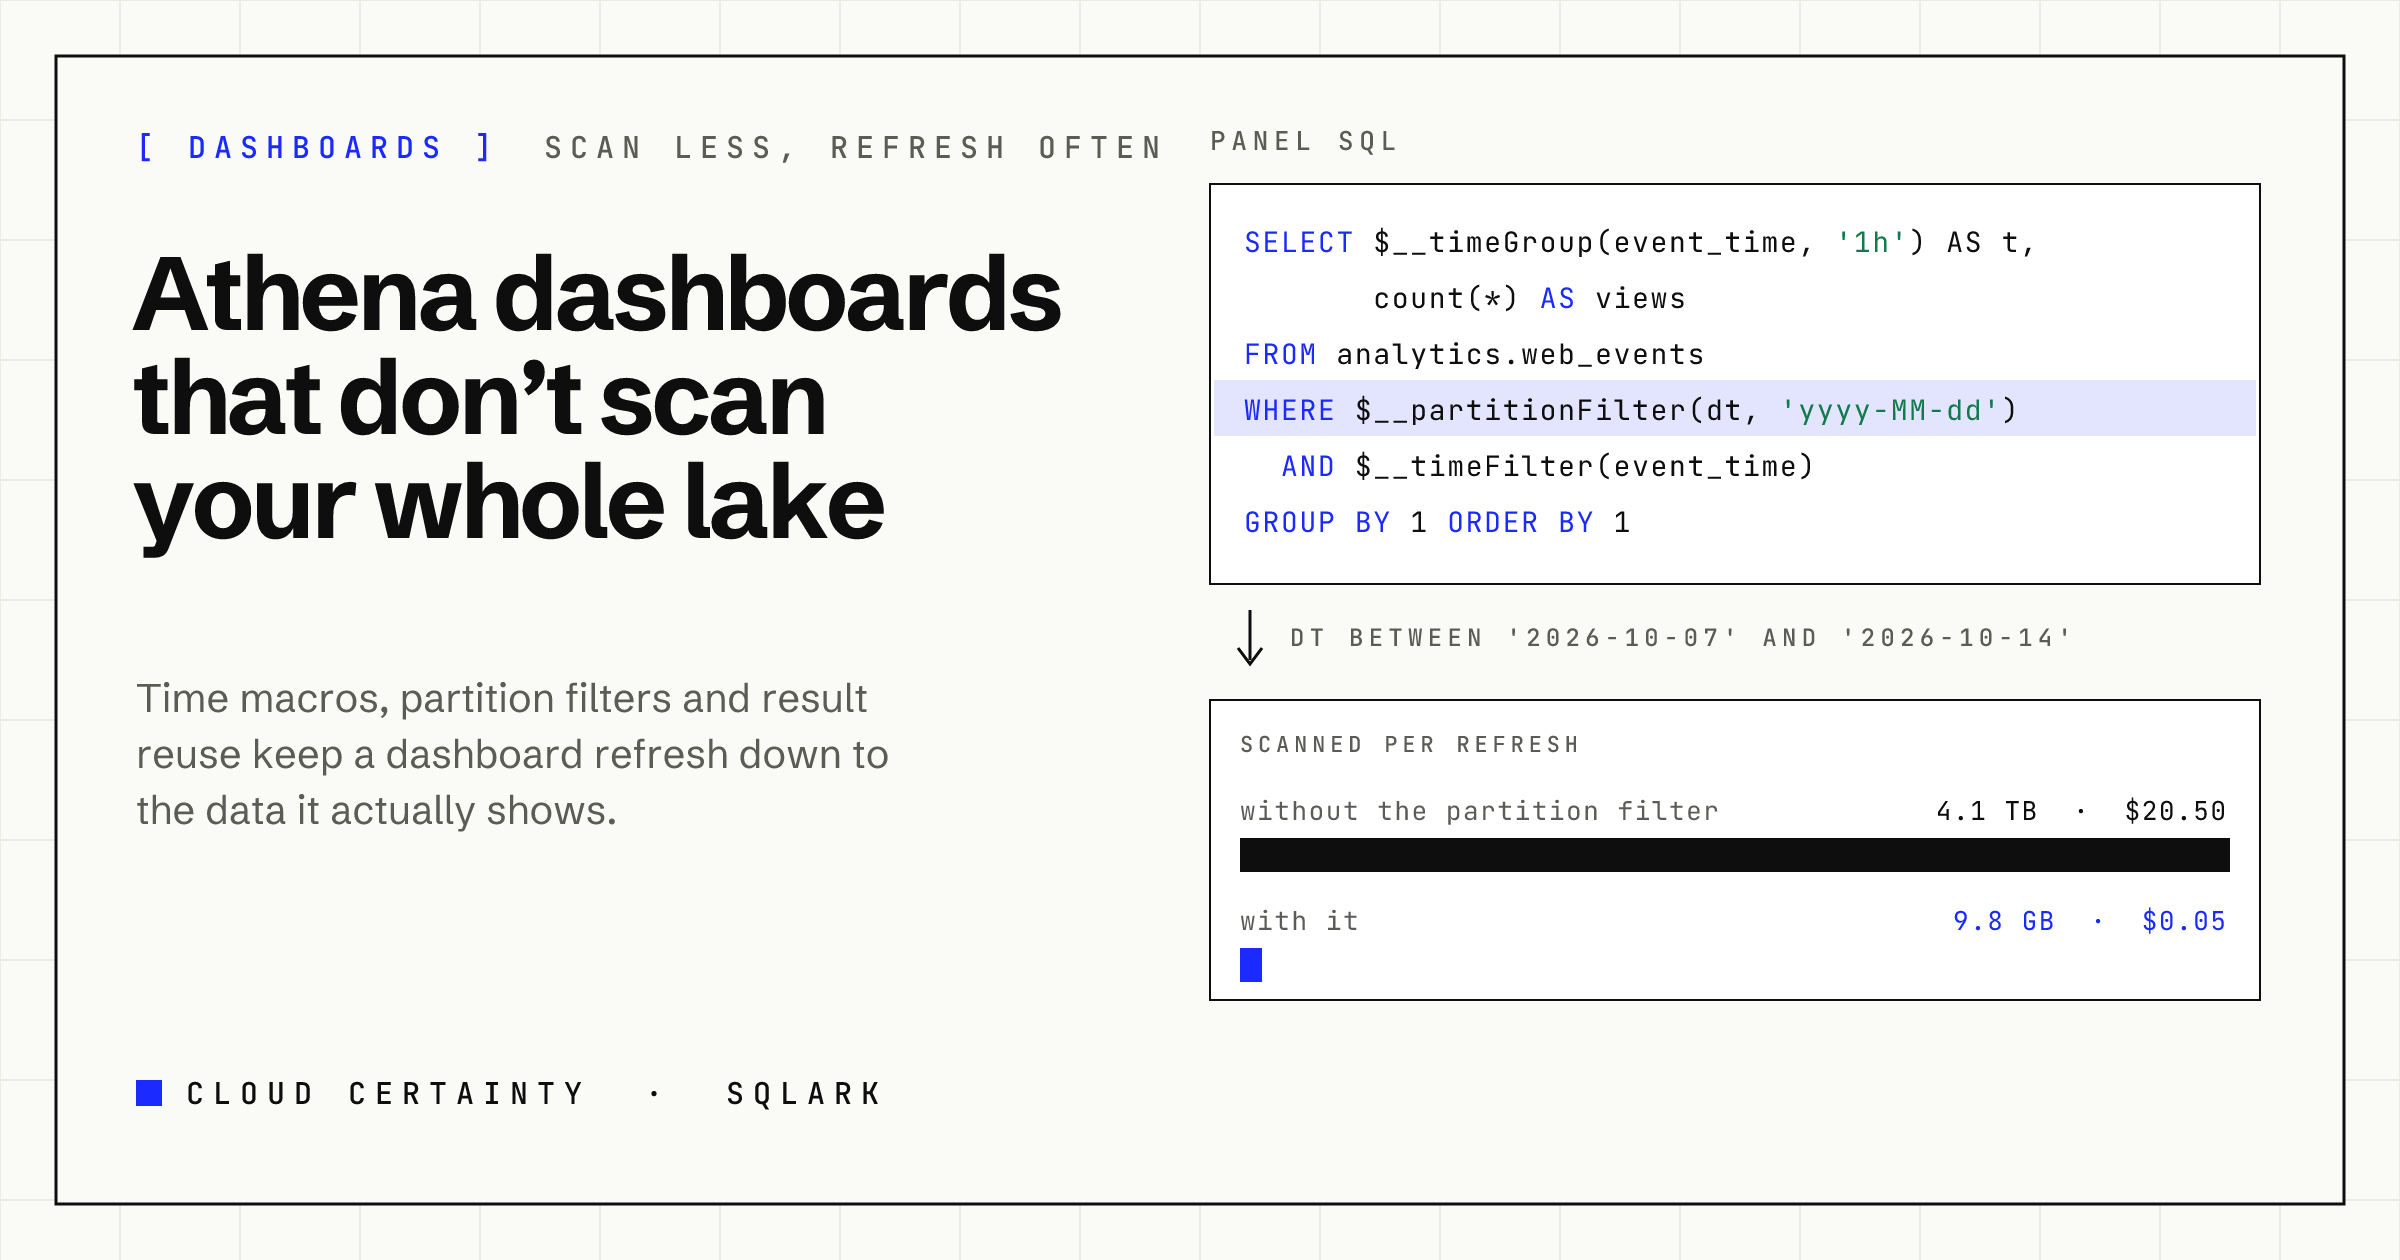
SELECT $__timeGroup(event_time, '1h') AS t, count(*) AS views
FROM analytics.web_events
WHERE $__partitionFilter(dt, 'yyyy-MM-dd')
  AND $__timeFilter(event_time)
GROUP BY 1
ORDER BY 1
and the dashboard fills in the current range on every refresh:
$__timeFilter(event_time)becomesevent_time BETWEEN TIMESTAMP '...' AND TIMESTAMP '...'.$__partitionFilter(dt, 'yyyy-MM-dd')becomesdt BETWEEN '2026-10-07' AND '2026-10-14', formatted the way your partitions are named. It also handles layouts such as'yyyy/MM/dd'and hourly partitions withHH.$__timeGroup(event_time, '1h')buckets timestamps, and$__intervalpicks a bucket size that gives about 300 points over the range, so a seven-day panel and a ninety-day panel both draw sensibly.
$__partitionFilter is SQLark's addition; it is the one that matters most for cost. Some worked numbers, for a table that grows by 6 GB a day and holds two years:
| Panel | Data scanned per refresh | Cost per refresh |
|---|---|---|
Filter on event_time only | about 4.4 TB | about $21.90 |
| With the partition filter, last 7 days | about 42 GB | about $0.21 |
| With the partition filter, last 24 hours | about 6 GB | about $0.03 |
Columnar formats (Parquet, ORC) cut it further, because Athena reads only the columns a query uses.
Not scanning at all
The cheapest query is the one that doesn't run. There are two layers of reuse, and SQLark uses both.
Athena's query result reuse. When a query asks for it, Athena returns the result of an identical earlier query in the same workgroup, up to seven days old (opens in a new tab), and charges nothing for it. SQLark sets the reuse age on every panel (60 minutes by default, per panel if you like). It has limits: it doesn't apply to workgroups whose results are managed by Athena, to federated catalogues, to Lake Formation governed tables or tables with row and column filters, or to queries over more than 20 tables. In those cases the query simply runs.
SQLark's own reuse, per person. When you refresh a dashboard, or two panels run the same SQL, SQLark returns your own recent execution of that SQL instead of starting another one. It is keyed to the person, so nobody ever sees a result they couldn't have produced themselves. It also works where Athena's reuse doesn't.
Between them, where Athena's reuse applies, a dashboard that ten people open in the same five minutes costs one scan per distinct query, not ten. Where it doesn't, each person still pays for a refresh only once.
Not running too much at once
Athena limits how many queries an account can run at the same time in each Region: the active DML query quota (opens in a new tab) ranges from 20 in smaller Regions to 200 in us-east-1, and queued queries count. A dashboard with thirty panels, opened by a few people, can hit that and start getting TooManyRequestsException.
SQLark runs at most four panels at a time per browser, polls their status in batches of up to fifty with one BatchGetQueryExecution call, backs off and retries when Athena says it is busy, and cancels queries for panels you navigate away from. Auto-refresh pauses while the tab is hidden, and the fastest refresh interval depends on your plan.
A checklist for every panel
- Filter on the partition column with
$__partitionFilter, not just on a timestamp. - Select the columns you need; avoid
SELECT *in panels. - Aggregate in SQL (
GROUP BYwith$__timeGroup), so the browser gets hundreds of rows, not millions. - Keep result reuse on, with an age that matches how fresh the panel needs to be.
- Put a per-query data scanned limit on the workgroup, as a guard rail for the panel you forgot.
SQLark's dashboards are built around these defaults, and every panel's query inspector shows the SQL as it ran, the data it scanned and what it cost. See the SQLark page (opens in a new tab) for the demo.